File:Voltage regulator foldback.svg
Da WikiAppunti.
Jump to navigation
Jump to search

Dimensioni di questa anteprima PNG per questo file SVG: 278 × 276 pixel. Altre risoluzioni: 242 × 240 pixel | 483 × 480 pixel | 604 × 600 pixel | 774 × 768 pixel | 1 031 × 1 024 pixel.
File originale (file in formato SVG, dimensioni nominali 278 × 276 pixel, dimensione del file: 45 KB)
Questo file proviene da Wikimedia Commons e può essere utilizzato da altri progetti. Di seguito viene mostrata la descrizione presente nella pagina di descrizione del file.
Dettagli
| DescrizioneVoltage regulator foldback.svg |
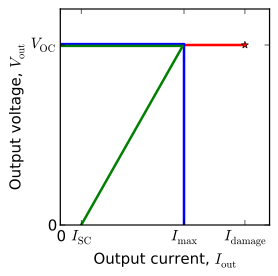
English: Voltage regulator V-I curves for foldback, current limited, and unlimited. |
| Data | |
| Fonte | Opera propria |
| Autore | Nanite |
| SVG sviluppo InfoField | Il codice sorgente di questo file SVG non è valido a causa di 1 errore. Questa grafica vettoriale non valida secondo il W3C è stata creata con Matplotlib. |
| Codice sorgente InfoField | Python code#Requires [[:wikipedia:matplotlib|matplotlib]]. Due to a bug in wikipedia's SVG renderer,
#the raw files appear with curves peeking outside of the axes.
#Before uploading the files were touched up by releasing and re-setting the clip paths.
from pylab import *
figtype = '.svg'
saveopts = {'bbox_inches':'tight'} #, 'transparent':True, 'frameon':True}
seterr(divide='ignore')
V_fb = concatenate([linspace(9.95,9.95,100, endpoint=False), linspace(9.95,0,101)])
I_fb = concatenate([linspace(0,0.995,100, endpoint=False), linspace(0.995,0.17,101)])
V_cl = concatenate([linspace(10.05,10.05,100, endpoint=False), linspace(10.05,0,101)])
I_cl = concatenate([linspace(0,1.005,100, endpoint=False), linspace(1.005,1.005,101)])
V_nl = linspace(10,10,151)
I_nl = linspace(0,1.5,151)
# Compute powers; Assume regulator is dropping voltage from a source 20% higher than V_oc.
P_cl = I_cl*(V_cl[0]*1.2 - V_cl)
P_fb = I_fb*(V_fb[0]*1.2 - V_fb)
P_nl = I_nl*(V_nl[0]*1.2 - V_nl)
Gcrit = 0.1
Rcrit = 10
Pcrit = 2
### Make V-I curve plot
fig = figure()
ax = axes()
xlim(0,1.7)
ylim(0,12)
ax.set_xlabel('Output current, $I_{\\rm out}$')
ax.set_xticks([I_fb[0], I_fb[-1], max(I_cl), max(I_nl)])
ax.set_xticklabels(['0', '$I_{\\rm SC}$', '$I_{\\rm max}$', '$I_{\\rm damage}$'])
ax.set_ylabel('Output voltage, $V_{\\rm out}$')
ax.set_yticks([0,10])
ax.set_yticklabels(['0', '$V_{\\rm OC}$'])
ax.plot(I_nl, V_nl, 'r', linewidth=2)
ax.plot([I_nl[-1]], [V_nl[-1]], 'r*', linewidth=2)
ax.plot(I_cl, V_cl, 'b', linewidth=2)
ax.plot(I_fb, V_fb, 'g', linewidth=2)
fig.set_size_inches(3,3)
fig.patch.set_alpha(0)
savefig('foldback-vi'+figtype, **saveopts)
### Make power and resistance load plot
fig = figure()
ax = axes()
xlim(0,0.5)
ylim(0,13)
ax.set_xlabel('Load conductance ($\Omega^{-1}$)')
#ax.set_xticks([0,0.1])
#ax.set_xticklabels(['0', '$G_{\\rm crit}$'])
ax.set_ylabel('Regulator heating power (W)')
ax.set_yticks([0,
round(P_fb[100],1),
round(max(P_fb),1),
round(P_fb[-1],1),
round(P_cl[-1],1)])
#ax.set_yticklabels(['0', '$P_{\\rm max,FB}$', '$P_{\\rm SC,FB}$','$P_{\\rm SC,CL}$'])
# Plot heat in regulator vs. conductance
ax.axvline(Gcrit, color='#777777', linestyle='dashed', linewidth=0.5)
ax.axhline(P_fb[-1], color='#777777', linestyle='dashed', linewidth=0.5)
ax.axhline(P_cl[-1], color='#777777', linestyle='dashed', linewidth=0.5)
ax.plot(I_nl/V_nl, P_nl, 'r', linewidth=2)
ax.plot([(I_nl/V_nl)[-1]], [P_nl[-1]], 'r*', linewidth=2)
ax.plot(I_cl/V_cl, P_cl, 'b', linewidth=2)
ax.plot(I_fb/V_fb, P_fb, 'g', linewidth=2)
ax.text(Gcrit/2, 9, 'OK', horizontalalignment='center')
ax.text(0.3, 9, 'Overload', horizontalalignment='center')
fig.set_size_inches(3,3)
fig.patch.set_alpha(0)
savefig('foldback-loadcon'+figtype, **saveopts)
### Make power and conductance load plot
fig = figure()
ax = axes()
xlim(0,16)
ylim(0,13)
ax.set_xlabel('Load resistance ($\Omega$)')
ax.set_xticks([0,5,10,15])
#ax.set_xticklabels(['0', '$G_{\\rm crit}$'])
ax.set_ylabel('Dissipation in regulator (W)')
#ax.set_yticks([0,
# round(P_fb[100],1),
# round(max(P_fb),1),
# round(P_fb[-1],1),
# round(P_cl[-1],1)])
#ax.set_yticklabels(['0', '$P_{\\rm max,FB}$', '$P_{\\rm SC,FB}$','$P_{\\rm SC,CL}$'])
# Plot heat in regulator vs. resistance
amfb = argmax(P_fb)
# grey lines
ax.axvline(Rcrit, color='#777777', linestyle='dashed', linewidth=0.5)
ax.plot([0,V_fb[amfb]/I_fb[amfb]], [P_fb[amfb]]*2, color='#777777', linestyle='dashed', linewidth=0.5)
ax.plot([0,Rcrit],[Pcrit,Pcrit], color='#777777', linestyle='dashed', linewidth=0.5)
#curves
ax.plot(V_nl/I_nl, P_nl, 'r', linewidth=2)
ax.plot([(V_nl/I_nl)[-1]], [P_nl[-1]], 'r*', linewidth=2)
ax.plot(V_cl/I_cl, P_cl, 'b', linewidth=2)
ax.plot(V_fb/I_fb, P_fb, 'g', linewidth=2)
ax.text(Rcrit/2, 12, 'Overloaded', horizontalalignment='center')
ax.text(13, 12, 'Normal', horizontalalignment='center')
fig.set_size_inches(3,3)
fig.patch.set_alpha(0)
savefig('foldback-loadres'+figtype, **saveopts)
|
Licenza
Io, detentore del copyright su quest'opera, dichiaro di pubblicarla con la seguente licenza:
| Questo file è reso disponibile nei termini della licenza Creative Commons CC0 1.0 Universal. | |
| La persona che ha associato un'opera con questo atto legale ha donato tale opera nel pubblico dominio rinunciando a tutti i diritti sull'opera in tutto il mondo, inclusi tutti i diritti connessi o altri diritti simili, per quanto permesso dalla legge. Puoi copiare, modificare, distribuire ed utilizzare l'opera, anche a fini commerciali, senza chiedere alcun permesso.
http://creativecommons.org/publicdomain/zero/1.0/deed.enCC0Creative Commons Zero, Public Domain Dedicationfalsefalse |
Didascalie
Aggiungi una brevissima spiegazione di ciò che questo file rappresenta
Elementi ritratti in questo file
raffigura
Valore sconosciuto senza un elemento Wikidata
1 ago 2013
Cronologia del file
Fare clic su un gruppo data/ora per vedere il file come si presentava nel momento indicato.
| Data/Ora | Miniatura | Dimensioni | Utente | Commento | |
|---|---|---|---|---|---|
| attuale | 06:41, 2 ago 2013 |  | 278 × 276 (45 KB) | Nanite | labels, transparency |
Utilizzo del file
La seguente pagina usa questo file:
Metadati
Questo file contiene informazioni aggiuntive, probabilmente aggiunte dalla fotocamera o dallo scanner usati per crearlo o digitalizzarlo. Se il file è stato modificato, alcuni dettagli potrebbero non corrispondere alla realtà.
| Larghezza | 222pt |
|---|---|
| Altezza | 221pt |